AREC 261: Agricultural Data Analytics I

Foundations and Inference

Author

Peter Slade

Published

August 14, 2026

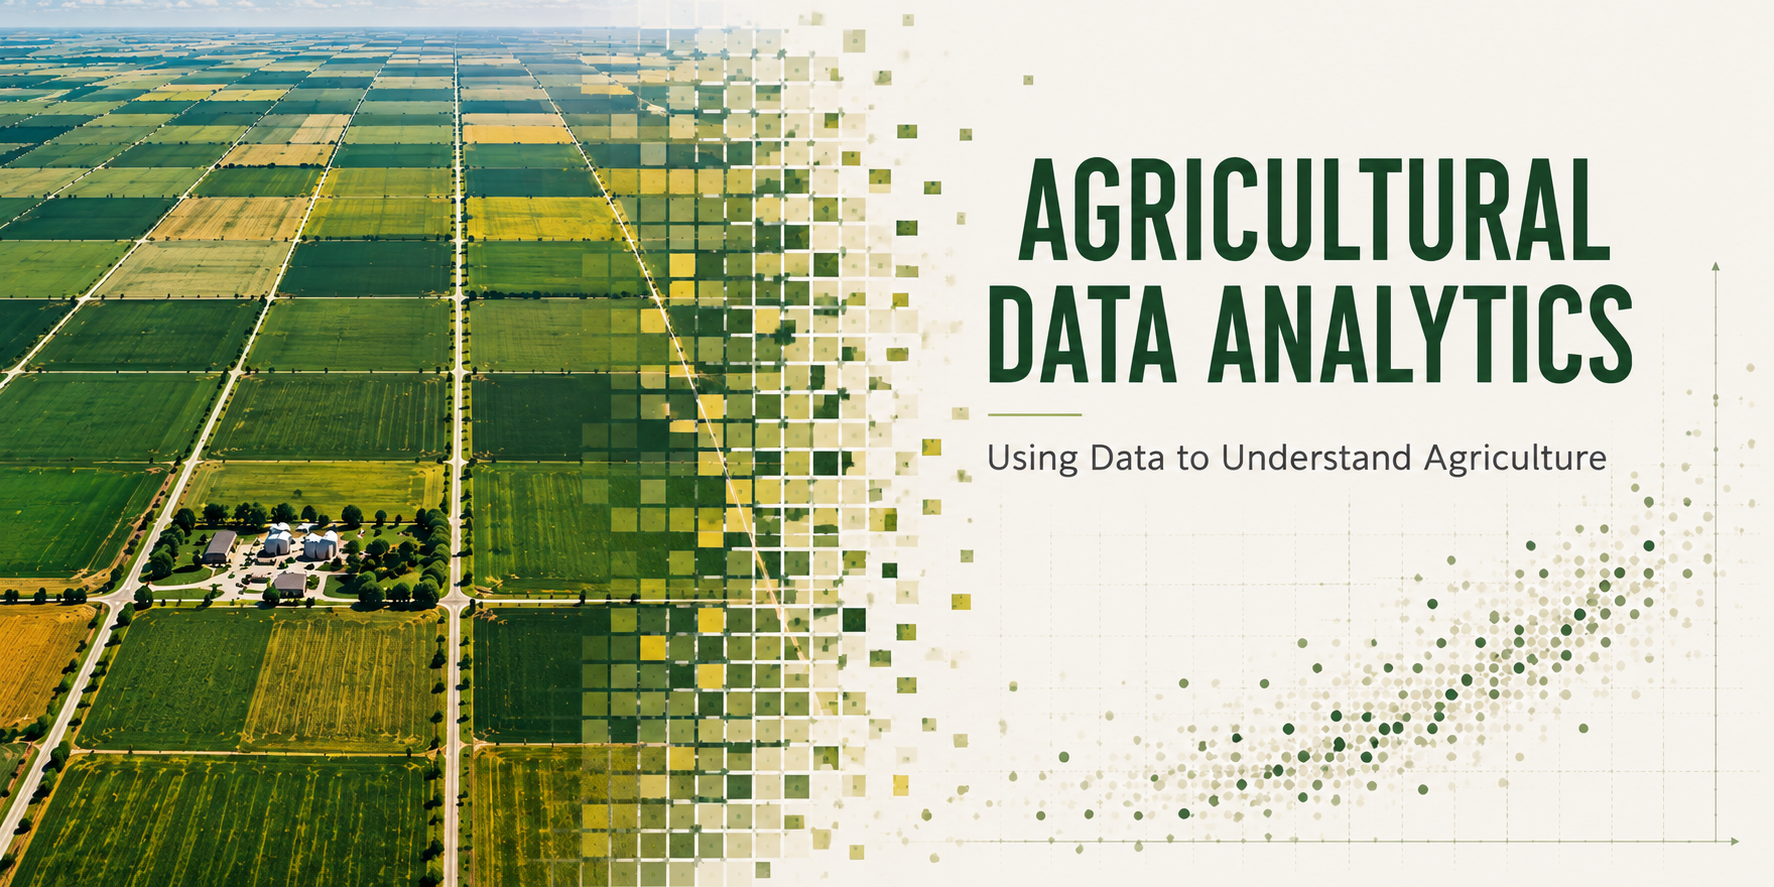
Agricultural Data Analytics — an aerial view of prairie farm fields dissolving left-to-right into a grid of pixels and then a scatter plot of data points.

Preface

Welcome to Agricultural Data Analytics I. This book is the primary reading for AREC 261 at the University of Saskatchewan. It accompanies the online lecture material, practice problems, and test banks for each of the twelve modules that make up the course.

The goal of this book — and the course it supports — is to get you doing real data analysis on real agricultural data as quickly as possible. By the end of the term you should be comfortable pulling a dataset into Excel or R, cleaning it up, summarizing it, visualizing it, and making careful, defensible claims about what the numbers mean. You should also be comfortable admitting what you don’t know, which, in data analysis, is at least as important as what you do.

A few notes on how to approach this book and this course:

  • Work through it with your hands on a keyboard. Data analysis is a skill, not a body of trivia. Reading about what a PivotTable does is not the same as building one. Every module has worked examples you should follow along with in Excel and R.
  • Don’t skip the “why” sections. It is tempting to jump straight to the buttons and menus. I do it all too often! But try to resist. Understanding why a tool exists — what problem it solves and what its assumptions are — is what separates someone who can click through an analysis from someone who can do an analysis.
  • Use the external resources. Throughout the book I point to many external resources, including textbooks, YouTube videos, and tutorials. Most sections end with a collapsible “Other resources” box — click it to expand a short list of optional places to go deeper (a matching section of the free OpenStax statistics textbook, an Excel for Dummies chapter, official Microsoft function references, and videos). You do not need any of these to succeed in the course — they are there for when my explanation of a concept doesn’t click and you want to hear it from a different point of view. Hearing explanations from several angles is one of the best ways to build a deep understanding.
  • Expect to be wrong (and frustrated) sometimes. Everyone who does data analysis makes mistakes — mislabeled columns, a decimal place in the wrong spot, a confidently wrong conclusion. The goal is not to be infallible; it is to build habits that catch mistakes quickly and make them easy to fix. However, it is not always easy to catch your own mistakes — everyone who has programmed before has spent hours looking for their error, only to arrive at an errant comma.

Artificial intelligence

The course comes with several AI-enhanced tools, and this book is one of them! I would hazard to guess that this is the most AI-forward class you have taken thus far. However, almost all of your evaluations will take place in class, without the use of AI. This means that you need to learn to write code, analyze data, and come to conclusions on your own. At the same time, AI can be extraordinarily helpful in your learning process. Ask questions of the course GPT, do practice quizzes with AI feedback, and if you can’t figure out a bug in your code, ask AI for help uncovering the bug and how you can better write code to avoid that kind of bug in the future.

My honest opinion is that very few of us will actually be writing code in the future – we have AI for that. In the same way that very few of us does long division by hand today — we have calculators for that. But we still learn long division in elementary school. Why? Because you cannot use a calculator well if you do not understand what it is doing. If you type a number wrong and the calculator spits out an answer that is off by a factor of ten, you need the numerical instincts to notice that the answer is wrong. Those instincts come from having done the arithmetic by hand, many times, until you built an intuition for what reasonable numbers look like.

The same thing is true of code and AI. The people who will use AI well over the next decade are the people who know what good code looks like — who can read a block the AI produced and spot the subtle bug, who can tell when the analysis is asking the wrong question, who can explain why a result is right or wrong. You cannot build that judgment without writing code yourself, struggling with it, and fixing your own mistakes. That is what this course is for. The AI is the calculator; you are learning to be the mathematician.

This book is a work in progress. If you find errors, unclear passages, or places where an extra example would help, please let me know. AI tools were used for brain storming, content generation, and editing – but I am responsible for all errors.

— Peter Slade