15 Coding Agents
An AI coding agent is a program that lives on your computer and can read your files, write code, run it and read the output. This allows you to give a simple command like “compute the average canola yield by year in the dataset rm_yields_1990_2025.csv” and have the agent write a script, run it, and fix any errors that come up.
This is a considerably different workflow than the one we have been using with chatbots. A chatbot can only see what you paste into it, and it cannot see your project or your R session. (Some chatbot apps can run code of their own, but in their environment and on the files you upload, not on your computer.) If you ask a chatbot to write code and it has errors, then you have to serve as the middleman between your console output and the chatbot. With an agent you eliminate this step.
15.1 What an agent actually does
The typical work flow with an agent is that:
- You give it a task.
- It reads whatever it needs – your
README.md, your data files, your existing scripts. - It writes or edits a file.
- It runs the code.
- It reads the output, including any errors.
- If something failed, it goes back to step 3.
- It messages you when it is done or when it cannot fix a problem.
Steps 4 and 5 are the ones that separate agentic coding from coding with a chatbot. It also means the agent is changing files on your computer. This brings in all sorts of danger – it can overwrite your files, expose sensitive information, or run malicious code. More mundanely, it can write code that produces a sensible output, but has errors within the code. For example, suppose you wanted to get the average yields of spring wheat from 1990 to 2025, and the agent wrote a script that computed the average of all wheat (including durum) instead. You might not notice this error unless you look through the code.
15.2 Managing context
With an AI coding agent context becomes even more important. A chatbot only ever sees what you paste into it, so you know exactly what it is working from. An agent reads your files on its own, which means it can pick up the right context without being told – and it can also work from something stale or irrelevant that happens to be sitting in your folder.
This is why the README.md from Section 14.1 matters more here than it did there. You pasted it into a chatbot conversation; an agent can read it off disk, so the standing instructions about using the tidyverse, commenting the code and explaining as it goes are already written down. It will not necessarily go and look, which is why the prompts below start by telling it to.
Keep the folder tidy for the same reason. An agent asked to work with “the yield data” in a folder holding four versions of it will pick one, and it may not pick the one you meant.
15.3 Agentic coding tools
There are several tools for agentic coding within Positron. These include:
- Claude Code
- Codex
- Posit Assistant
- Google Antigravity
15.4 Installing Antigravity
We will be using Google’s Antigravity agent. The simple reason is the free tier, which is more generous than what the other agents offer. However, we should note that this free tier is limited – you can only make a limited number of requests within a given week. You can monitor the amount of usage you have left.
To run Antigravity, you need to have a Google account.
Once you have a google account, you can install the Antigravity extension in Positron.
- Open the Extensions sidebar, either by clicking the Extensions icon in the Activity Bar or with
Cmd+Shift+Xon macOS,Ctrl+Shift+Xon Windows. - Search for Google Antigravity.
- Click Install.
- Click the Antigravity icon in the Activity Bar on the left, and sign in with a Google account. A personal Gmail account is fine.
The video above shows the installation process.
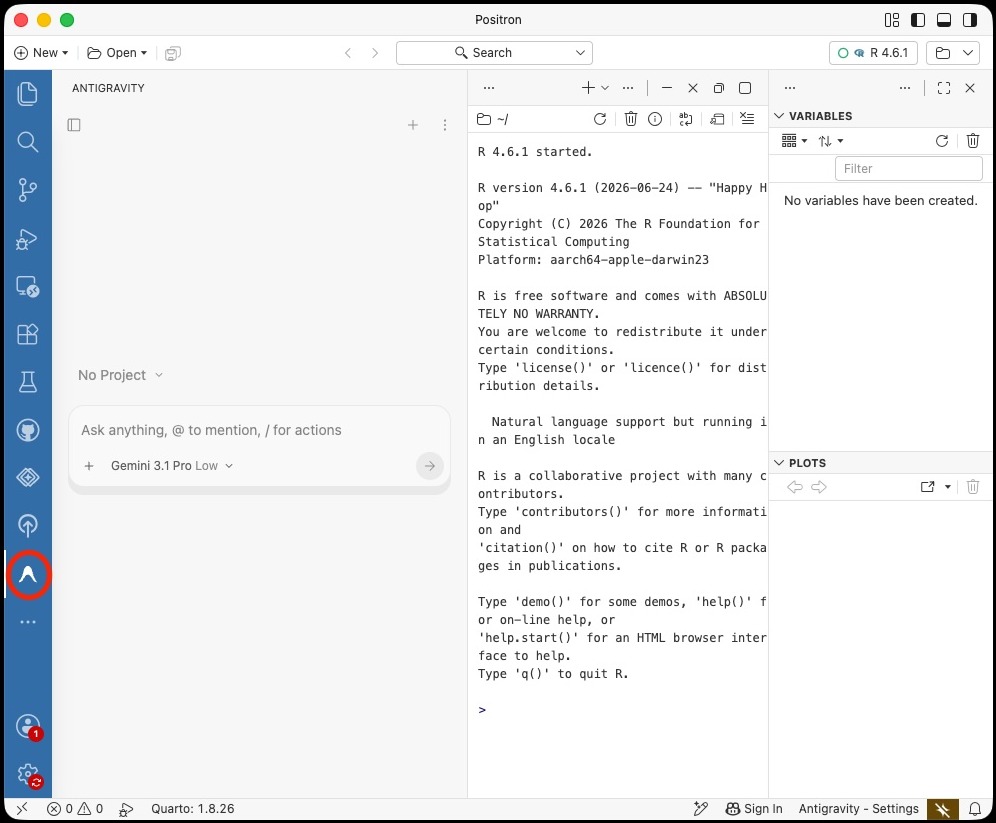
Once it is installed you can access it by clicking on the Antigravity icon in the Activity Bar. This opens a chat window where you can give it tasks.
It’s worth repeating that the free plan has a limit on the number of requests you can make. You can monitor your usage in the Antigravity extension. If you exceed the limit, you will have to wait until the next week to continue using it.
15.5 Giving it a task
You can treat the Antigravity chat as you would a chatbot. For example, you can ask it about errors that are in your code, or how to use a particular function. However, the real power of an agent is that it can read your files, write code, run it and read the output. This means you can give it a task and have it actually do the work for you.
When writing a prompt, be sure to provide as much detail as possible and instruct it to read your README.md file. For example, in the video above I asked it to:
Read my README.md file. Then write code and execute the code to graph annual average yields of spring wheat, durum wheat, canola, barley, oats, lentils and peas from 1990 to 2025 in Saskatchewan using data/rm_yields_1990_2025.csv. Save the code in code/module_5 and put the graph in output
Without any further prompting it generated the following code and graph:
# Load the tidyverse package which includes ggplot2 for graphing and dplyr for data manipulation
library(tidyverse)

# Read the CSV file containing the yield data
yield_data <- read_csv("data/rm_yields_1990_2025.csv")

# Create a vector (list) of the specific crops we want to keep
target_crops <- c("Spring Wheat", "Durum", "Canola", "Barley", "Oats", "Lentils", "Peas")

# Start with the yield data and then...
annual_yields <- yield_data %>%
  # Filter the data to only include rows where the Crop is in our target_crops list
  filter(Crop %in% target_crops) %>%
  # Group the data by Year and Crop so our summary is calculated for each crop in each year
  group_by(Year, Crop) %>%
  # Calculate the average (mean) yield for each group, ignoring any missing values (NA)
  # The .groups = "drop" argument prevents a warning message about grouped output
  summarize(average_yield = mean(Yield, na.rm = TRUE), .groups = "drop")

# Start building a plot with ggplot using our new summarized data
# aes() maps the data variables to visual properties: Year to x-axis, average_yield to y-axis, and Crop to color
yield_plot <- ggplot(annual_yields, aes(x = Year, y = average_yield, color = Crop)) +
  # Add lines to connect the data points over time
  geom_line(linewidth = 1) +
  # Add points to clearly see each year's specific value
  geom_point(size = 2) +
  # Add a title and label the axes to make the graph easy to understand
  labs(
    title = "Annual Average Yields in Saskatchewan (1990 - 2025)",
    subtitle = "Data averaged across all rural municipalities",
    x = "Year",
    y = "Average Yield (bu/ac)",
    color = "Crop"
  ) +
  # Apply a clean, minimalistic theme to the plot
  theme_minimal()

# Save the plot we just created to the output folder as a PNG image file
ggsave("output/annual_average_yields.png", plot = yield_plot, width = 10, height = 6)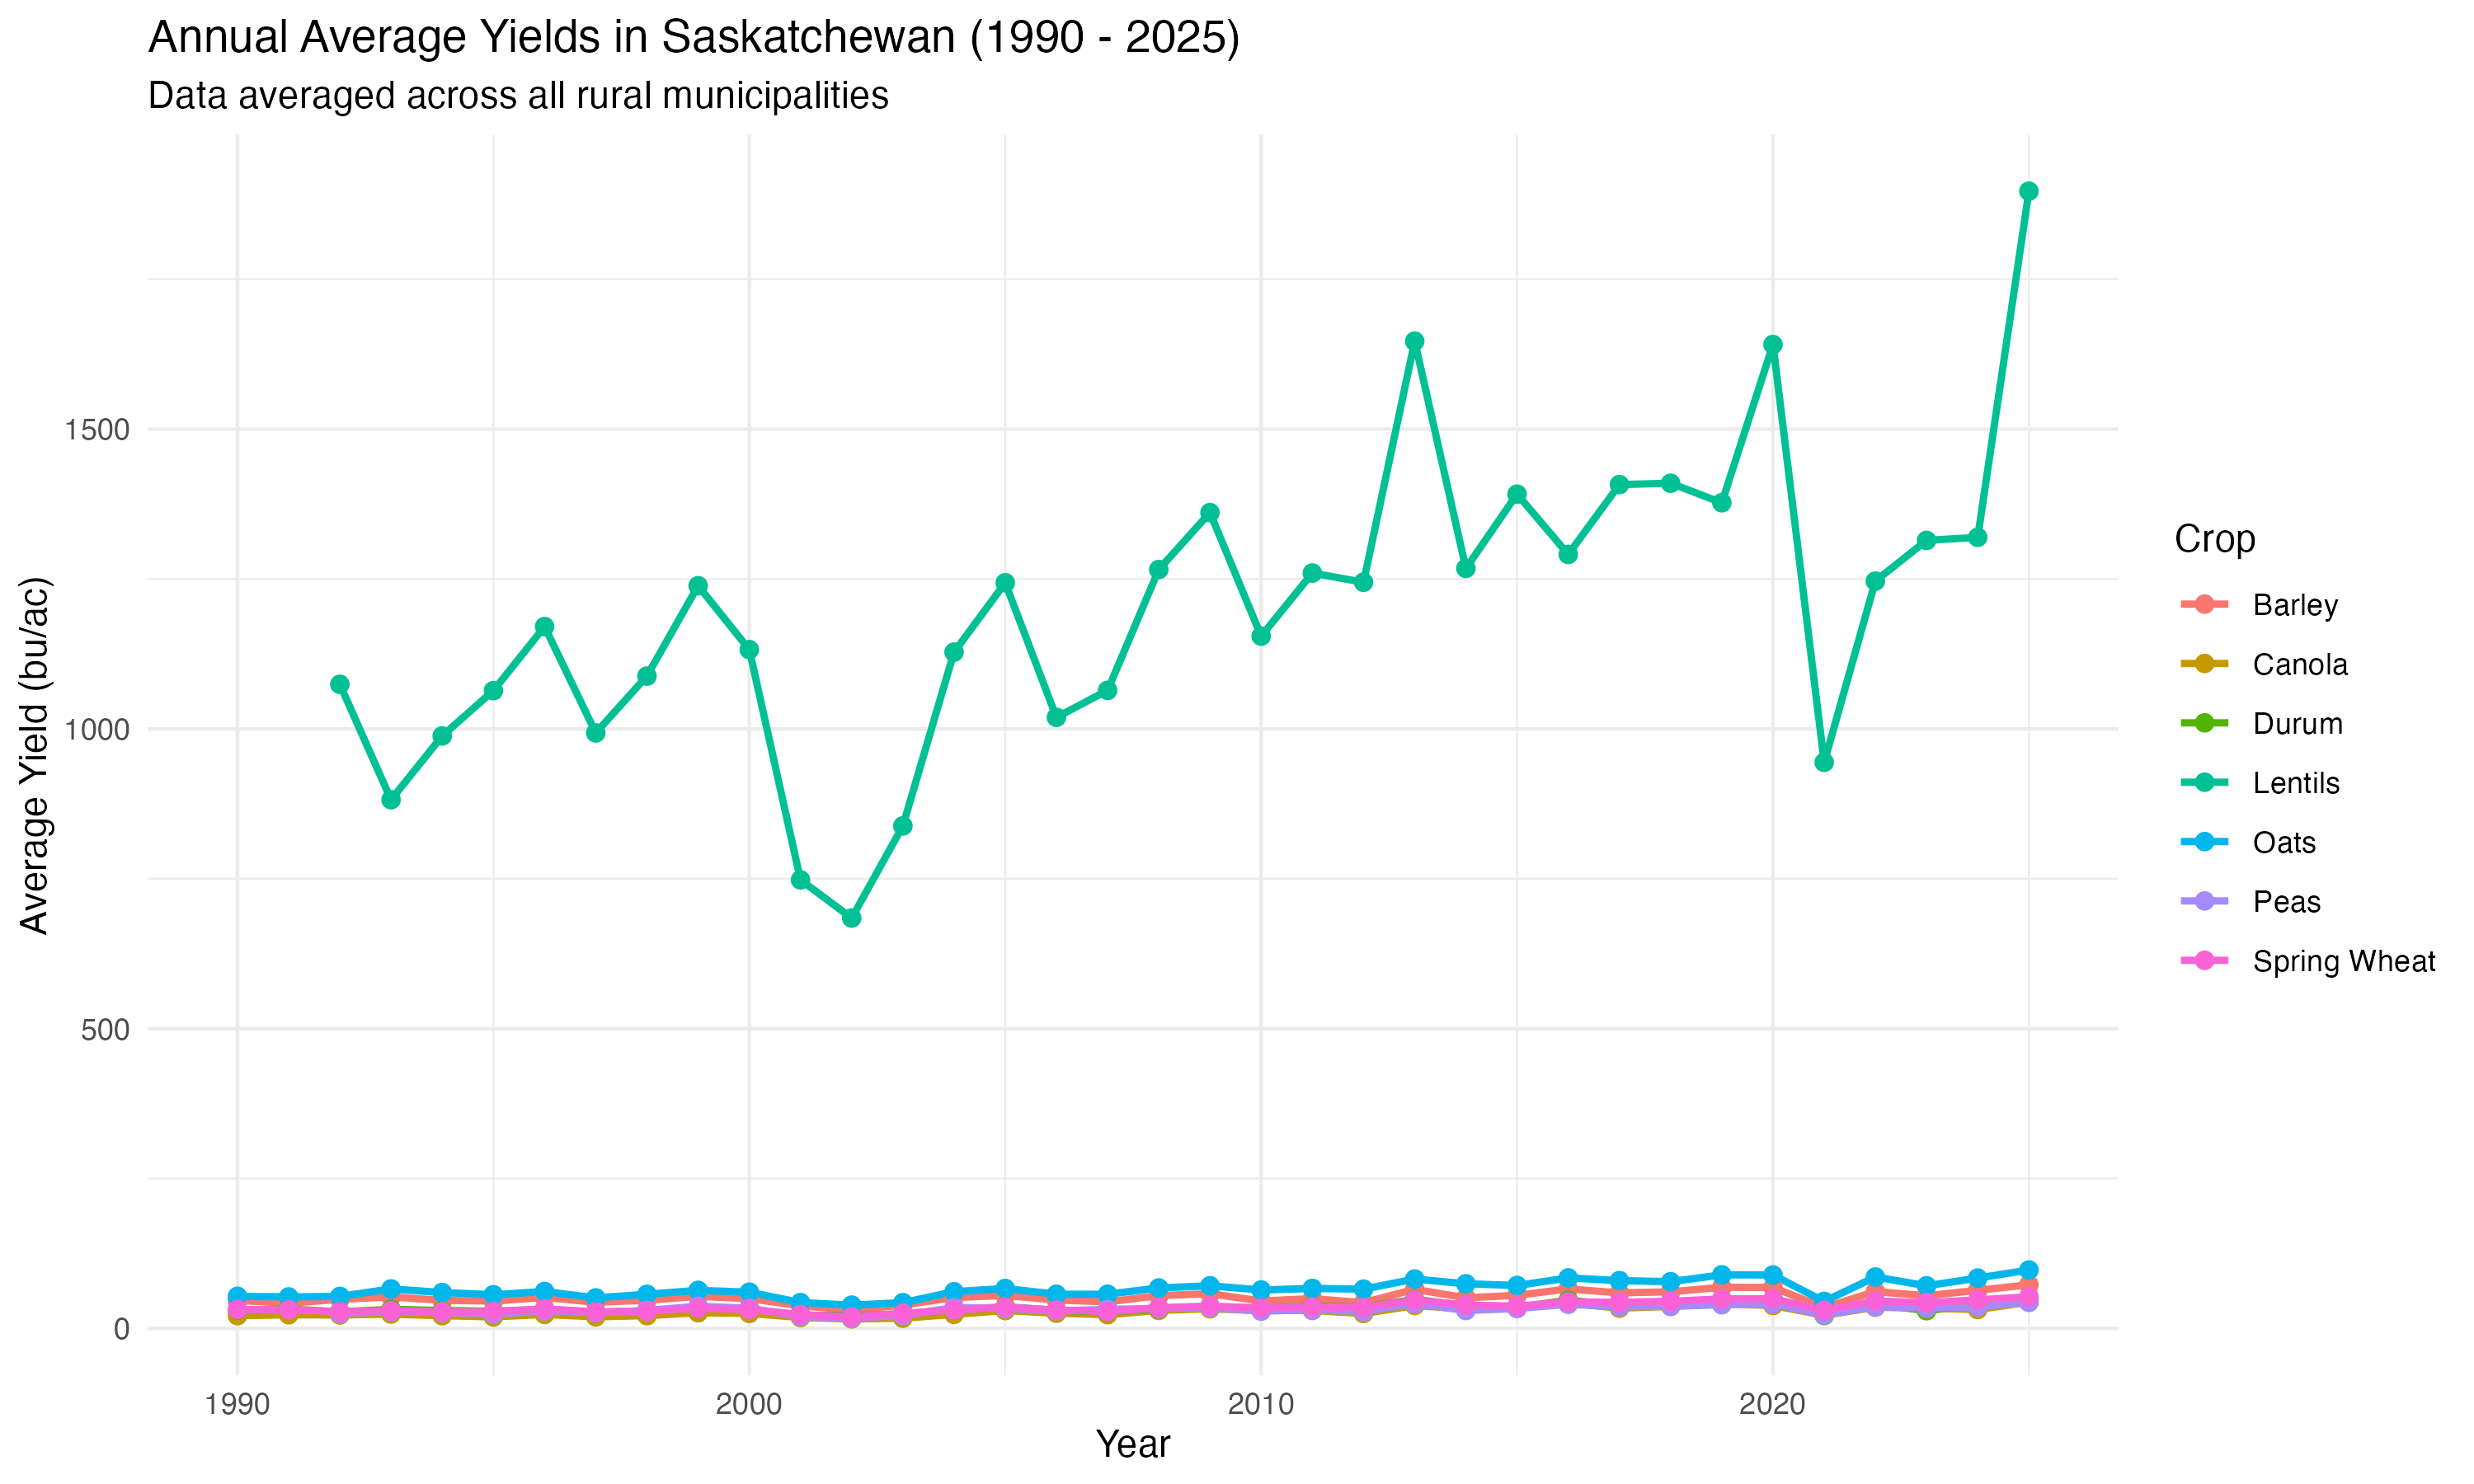
The issue with this graph is that lentils are measured in pounds per acre while every other crop is in bushels per acre. Lentil yields of around 1,200 lb/ac dwarf the 20 to 90 bu/ac of everything else, so the six other crops are squashed into a flat band along the bottom and nothing about them can be read. The axis label says bu/ac, which is wrong for one of the seven lines. The agent did not inspect the Unit column, which is right there in the file it read.
To remove lentils, I could have changed the code myself. But instead I just followed up with another prompt:
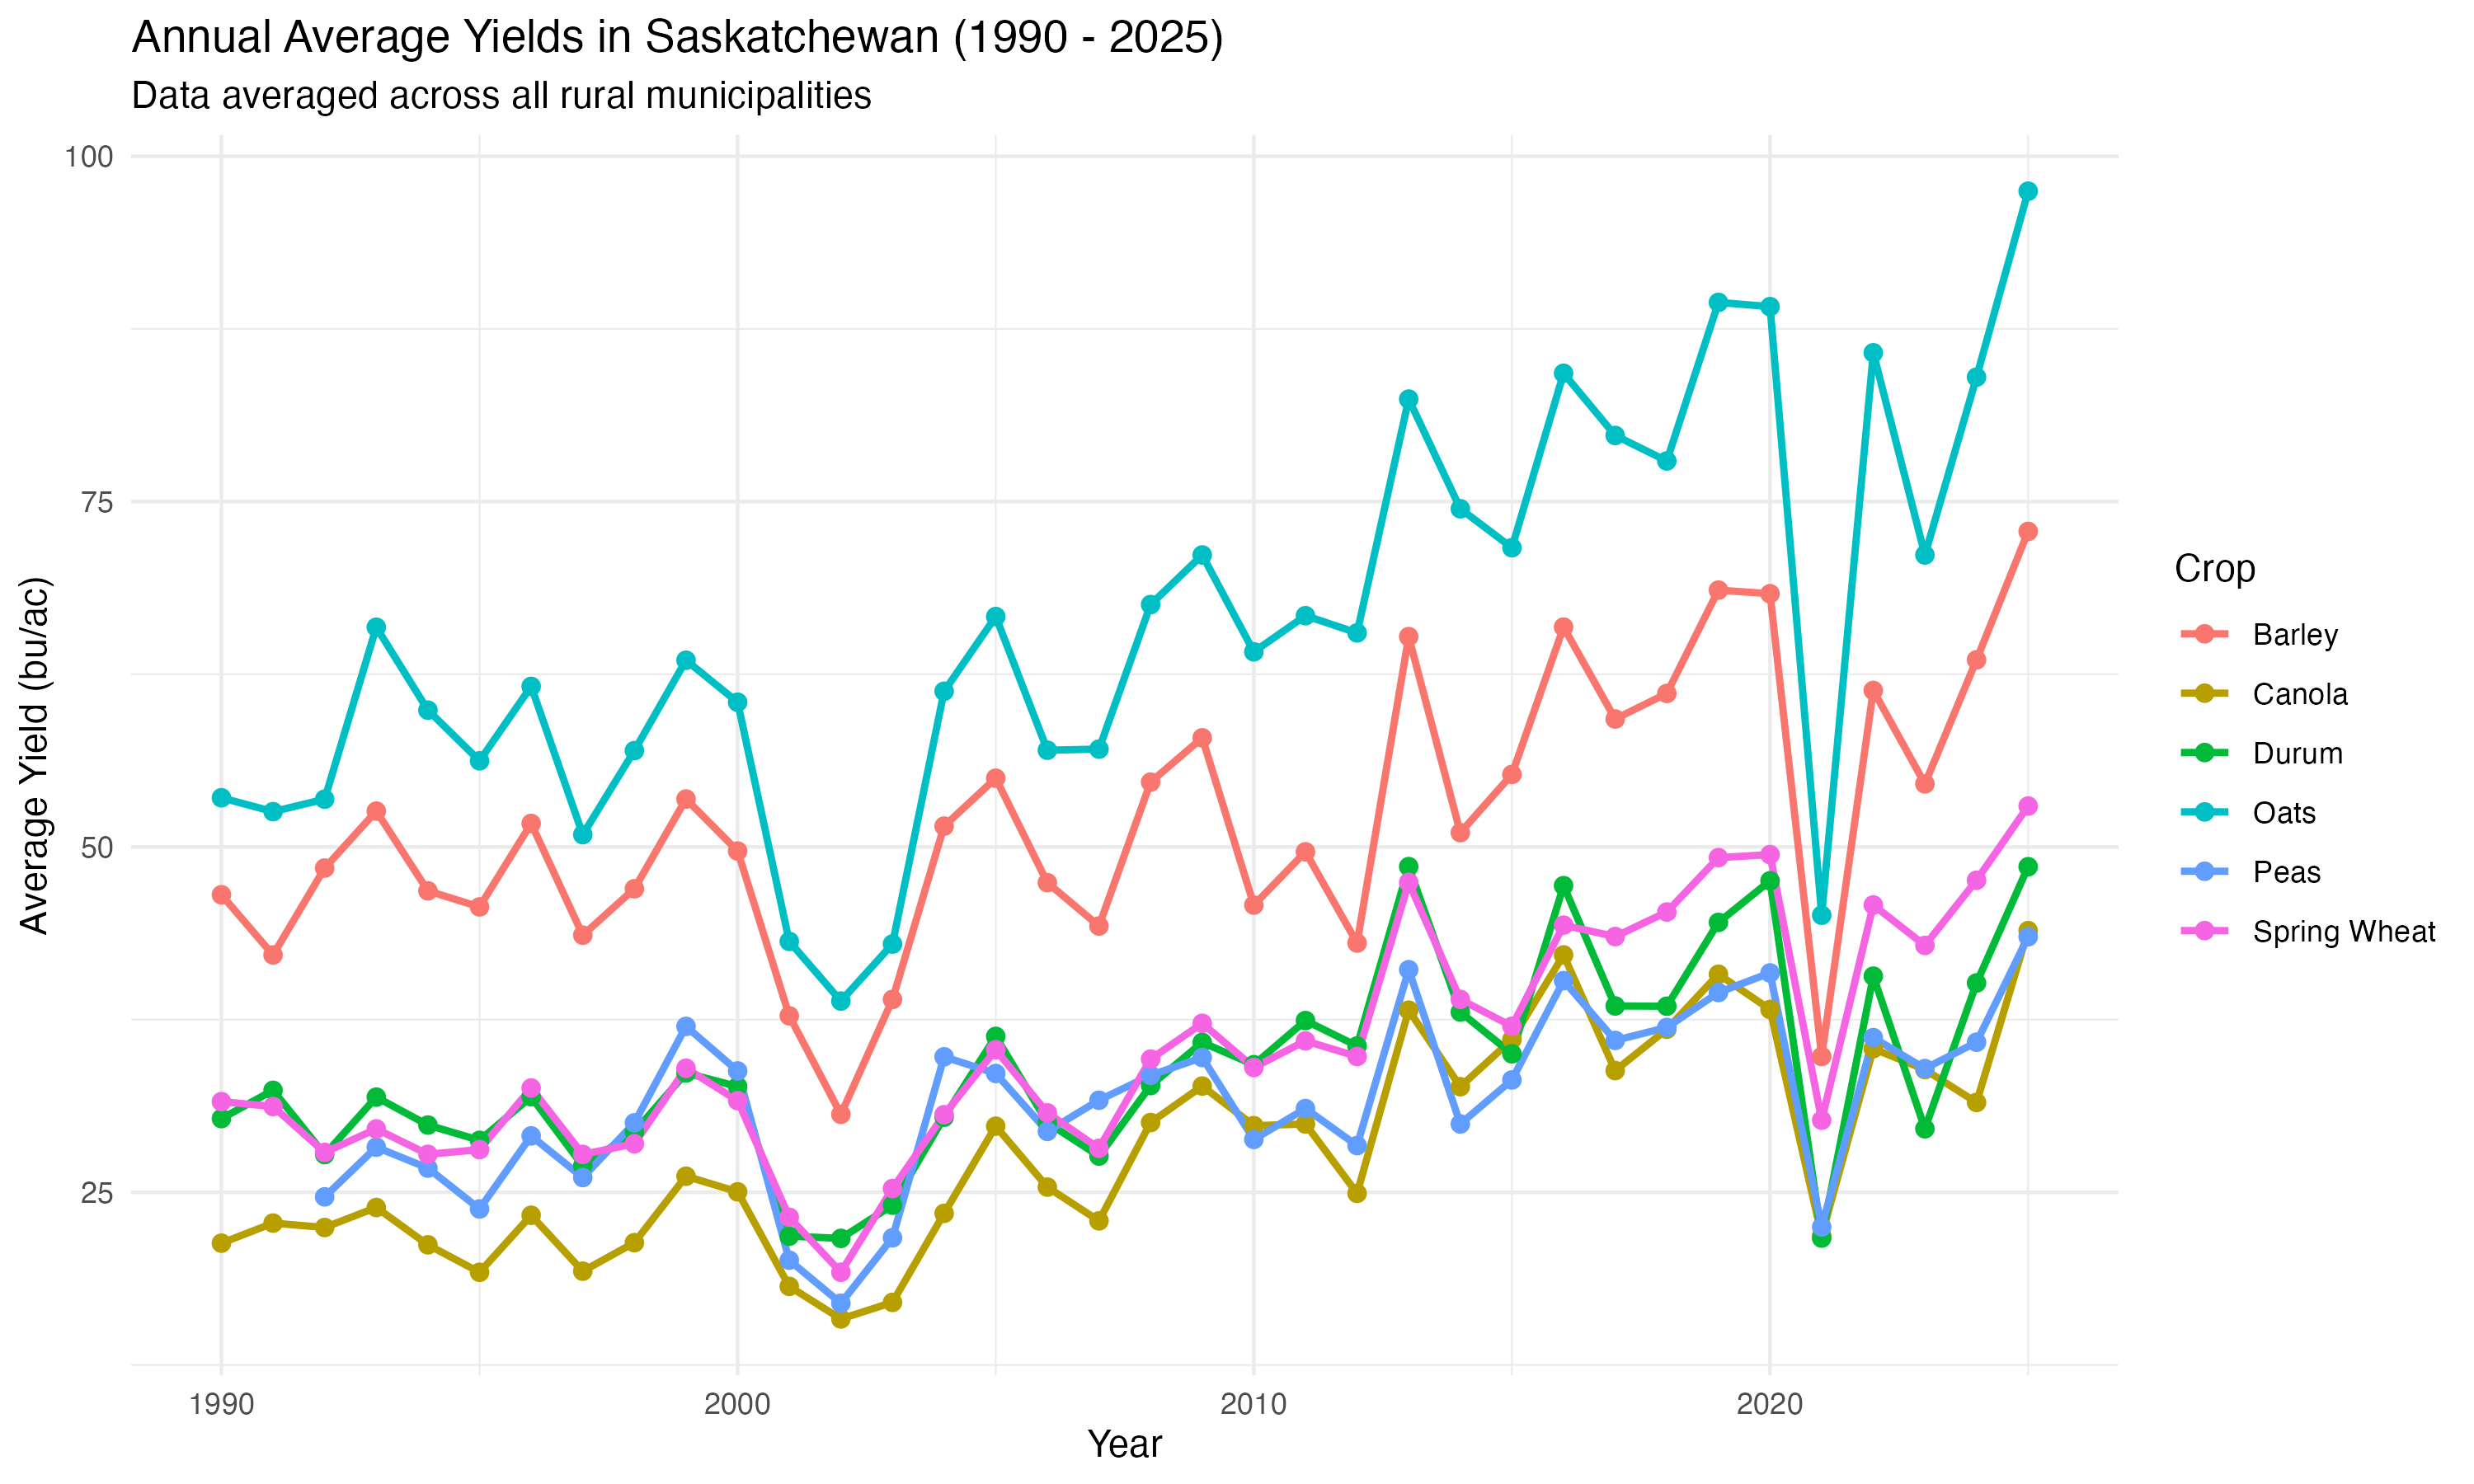
Remove lentils from the plot
and it did just that, saving the following graph in my output folder:
15.6 Checking what it did
Remember that you are responsible for the result. The agent wrote it, but you will be submitting it.
In the example above, I can look through the code and verify that it is doing what I asked. I can also check the output graph to see if it looks reasonable. If it does not, I can ask the agent to explain what it did, or to fix the code.
If you cannot follow what the script does, that is the signal to slow down and ask it to explain, rather than to accept it because the output looked reasonable.
15.7 Other resources – agents
- Antigravity – the extension and what it can do
- Positron Assistant – if you would rather connect a different model