Module 5 Assignment
You have been assigned one rural municipality in Saskatchewan. Everything in this assignment is about that RM and the risk zone it sits in, so your numbers will not match anyone else’s.
The deliverable is a report of about five pages (depending on how large your figures are), plus a short section on how you used AI to produce it.
Submit on Canvas before your deadline. As with other assessments you will need an 80% to pass. If you don’t receive this grade, you will be asked to redo (portions of) the assignment and the usual grade penalty will apply.
Your RM and risk zone
Your RM number is on the assignment page in Canvas.
Saskatchewan Crop Insurance divides the province into 23 grains risk zones. A zone groups RMs that face broadly similar growing conditions, and it is the unit SCIC uses to set premiums. Find your RM on the map below and note which zone it falls in.
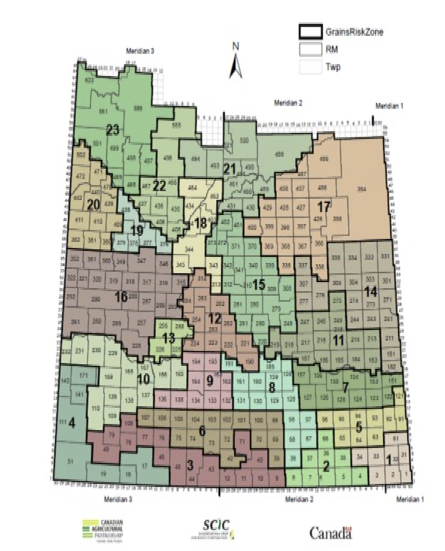
The numbers inside each small polygon are RM numbers; the large bold numbers are zone numbers. You may need to open the image at full size to read it.
The data
Two files, both from the course data folder:
rm_yields_1990_2025.csv– yields by RM, crop and year, 1990 to 2025.sask_variety_yields.csv– acres and yields by risk zone, crop and variety, 2021 to 2025.
The crop names are not written the same way in the two files. One says Canola, the other Canola/Rapeseed; one says Durum, the other Wheat - Durum. Reconciling them is part of the work.
What your report should cover
1. Yields in your RM over time. Plot the yield of each of the seven major crops – spring wheat, durum, canola, barley, oats, lentils and peas – in your RM from 1990 to 2025. Not every RM grows every crop; say which ones yours does.
Describe how the yields have changed over time, and whether there are any interesting relative trends across crops.
2. Your RM against the province. Compare those yields with the provincial average for the same crops. Where does your RM sit, and does the gap look the same across crops and across years?
3. Acres by crop in your risk zone. Using the variety data, plot the acres grown of each crop in your zone. This file covers 2021 to 2025 only, so this is a recent picture rather than a trend.
4. Varieties of your zone’s most common crop. Take the crop with the most acres in your zone. Plot the yields and the acres of its varieties.
What is the spread between the lowest and the highest yielding variety? Explain whether you think the difference between varieties can be treated as causal – that is to say, are the differences in yield due to the varieties themselves, or maybe due to the type of producers who grow these varieties. This question foreshadows what we will cover next in the class.
5. Adoption in your zone against the province. For that same crop, compare how its varieties are taken up in your zone with how they are taken up province-wide. Is your zone typical, or does it favour something the rest of the province does not?
Use of AI
There is no limit on how much AI you can use, but (a) you must describe how you used it, and (b) you are responsible for the accuracy of the results.
Writing about your use of AI
The last section of the report is about how you produced the rest of it. Cover:
- What you used and how you used them. Which tools did you use. How did you prompt it.
- How you verified the output.
- What worked and what didn’t. Did you find that some prompts gave you garbage output, or that some tools were better than others for certain tasks?
- One paragraph on what your workflow would be if you were to create a similar report in the future.